

Understanding Why Your ROAS Doesn’t Match Meta’s Reports :
You log in to Meta Ads Manager, view the ROAS column and see 4.8x.
Next, you look at the Shopify sales or GA4 revenue or CRM and do the calculation yourself. Now the ROAS is much more like 2.9x.
So which number is correct?
Neither one is necessarily wrong most times. The reason for this is that Meta, Google Analytics, ecommerce platforms, and your internal finance systems may have differing standards in identifying, attributing, and valuing the same conversion.
HubSpot demonstrates how attribution windows can impact the attribution of conversions in marketing interactions, how various attribution models can influence revenue and conversion counts, and how they can alter ROAS. This makes it easier to understand why there can be discrepancies between Meta Ads and other reporting systems when it comes to the same campaign.
This is one of the most frequently occurring reporting issues for companies that spend a lot on paid social. This is also one of the reasons why a well-regarded Digital Marketing Company in Ahmedabad should never base its reporting solely on the Meta ROAS figures.
Meta is created to help optimize advertising within the Meta environment. Your financial or e-commerce software is created to inform you about what happened in reality. They are similar questions, but they are different questions.
The attribution is explained by Google as the allocation of credit to various advertisements in relation to the significant event in the customer’s path through different touch points. The attribution model therefore produces different results depending on the conversion.
The important question is not:
“Why is Meta wrong?”
It is:
“Which measurement rules are leading to the creation of each number, and what number will be used in making the decision?”

The Short Answer: Meta ROAS Is Not the Same as Business ROAS
The Meta ROAS is typically determined using the conversion value that was generated from Meta ads as compared to the amount spent on the ads.
The basic formula is:
ROAS = Attributed Conversion Value ÷ Advertising Spend
For example:
| Metric | Example |
| Meta ad spend | 10,000 |
| Revenue attributed by Meta | $40,000 |
| Meta-reported ROAS | 4.0x |
| Actual ecommerce revenue during period | $29,000 |
| Revenue reconciled to Meta | $25,000 |
| Business-reported ROAS | 2.5x |
A 4.0x from Meta does not guarantee that all the $40,000 extra revenue generated came from Meta only.
A good campaign may result from the collaborative effort of the Digital Marketing Agency, strategic approach, target audience considerations, among others.
Similarly, just because you have an internal rate of 2.5x doesn’t mean that Meta created $25,000
The difference is due to the measuring system.
This is especially significant when communicating about the performance of the campaign to the customer. It can happen that the campaign appears great from Ads Manager’s standpoint but underperforms badly in terms of contribution margins, taking into account all the acquisition costs.
Thus, the reporting process needs to be known before the figure can be understood.
Explore our full range of marketing services designed to elevate your brand and drive meaningful growth.
Discover innovative solutions tailored to help your business stand out, connect, and succeed.
Explore Our ServiceWhat ROAS Really Means ?
The ROAS metric compares ad revenue to the amount spent on ads.
If you spend $5,000 and generate $20,000 in attributed revenue:
$20,000 ÷ $5,000 = 4.0x ROAS
But ROAS is not the same as profit.
Suppose that $20,000 in revenue produces:
- $8,000 product cost
- $2,000 fulfilment and shipping
- $1,500 payment and platform costs
- $5,000 advertising spend
That leaves only $3,500 before other overheads.
The campaign yielded a return on advertising spend of 4.0 times but did not result in $15,000
That’s precisely why Digital Marketing Services that are highly advanced shouldn’t stop with only one nice dashboard figure.
A useful reporting hierarchy is:
Spend → Revenue → ROAS → Contribution Margin → Profit → Incremental Profit
ROAS has its uses. It just shouldn’t be considered to be the definitive answer.
9 Reasons Your ROAS Does Not Match Meta :
There can be many valid reasons for discrepancies. In fact, it is often in these four areas that discrepancies become the most problematic.
Google Analytics clarifies how attribution models attribute credit to advertising, click-throughs, and other customer interactions that help marketers realize why various platforms display different conversion rates and revenue figures.
1. Meta and Your Analytics Platform Use Different Attribution Rules
Attribution is the primary cause why two platforms may differ.
Think about a customer who sees your Meta ad on Monday, clicks on it on Tuesday, searches for your brand on Wednesday, and buys on Thursday.
Who gets the sale?
However, Meta may capture any or all of the value if it applies certain attribution rules.
Google Analytics may assign credit differently.
However, your Shopify or ecommerce system will only attribute the successful transaction to the customer’s origin or session. This makes it very important that the performance marketing agency should analyze attribution throughout the customer’s entire journey.
Your CRM may associate the sale with the first lead source.
There is no uniform attribution methodology through which all four systems will report consistent figures.
That, by itself, can make a big difference.
2. Your Attribution Window Is Different
Another critical problem is the attribution window.
Consider this customer journey:
Day 1: User sees Meta ad
Day 3: User clicks Meta ad
Day 6: User returns through organic search
Day 7: User purchases
In case Meta’s reporting policies attribute the ad impression, and the analytics tool uses a different approach to analyze the conversion process, the income may end up being reported under different metrics.
This becomes particularly significant for products with longer consideration periods.
A B2B service worth $1,500, for instance, may require weeks to get converted. An impulse buy at lower cost will take only minutes to get converted.
The appropriate measurement approach therefore depends partly on the buying cycle.
3. View-Through Conversions Can Increase Meta’s Reported Revenue
All customers may not click on an advertisement before purchasing it; thus, a Digital Marketing Company needs to consider click attribution as well as view-through attribution while measuring their campaign results.
A person might:
- See an Instagram advertisement.
- Ignore it.
- Visit the company’s website later.
- Search the company name.
- Purchase.
Based on the attribution guidelines that may apply, Meta can still receive conversion credit.
The following becomes especially important while comparing Meta to click-based traffic attribution systems.
It does not mean Meta didn’t provide any value. What it means is that you have to be able to separate attributed conversions from incremental conversions.
That distinction matters enormously when deciding whether to increase a media budget.
4. Meta’s Conversion Data and Your Website Data May Not Be Identical
Your website may record 100 purchases.
Meta may record 87.
Or Meta may report 112 attributed purchases.
Neither one should be used before an investigation of the process leading to the event is made.
Meta Pixel records events on websites, but Conversions API enables the transfer of event data to Meta from a server or website platform, an application or CRM. Meta explains that using Conversions API is a better way of collecting data and making a more reliable connection.
This can be done concurrently with website development services in Ahmedabad to make sure that the website tracking, server-side events, and customer information are correctly integrated for better measurement.
A strong tracking setup therefore needs to answer:
- Is the Purchase event firing?
- Is the event firing once?
- Is the purchase value correct?
- Is the currency correct?
- Is the transaction ID being passed?
- Are browser and server events properly deduplicated?
- Are refunds handled consistently?
- Are cancelled orders excluded where appropriate?
If the tracking problem is not solved correctly, then the strong campaign may be perceived as weak and vice versa.
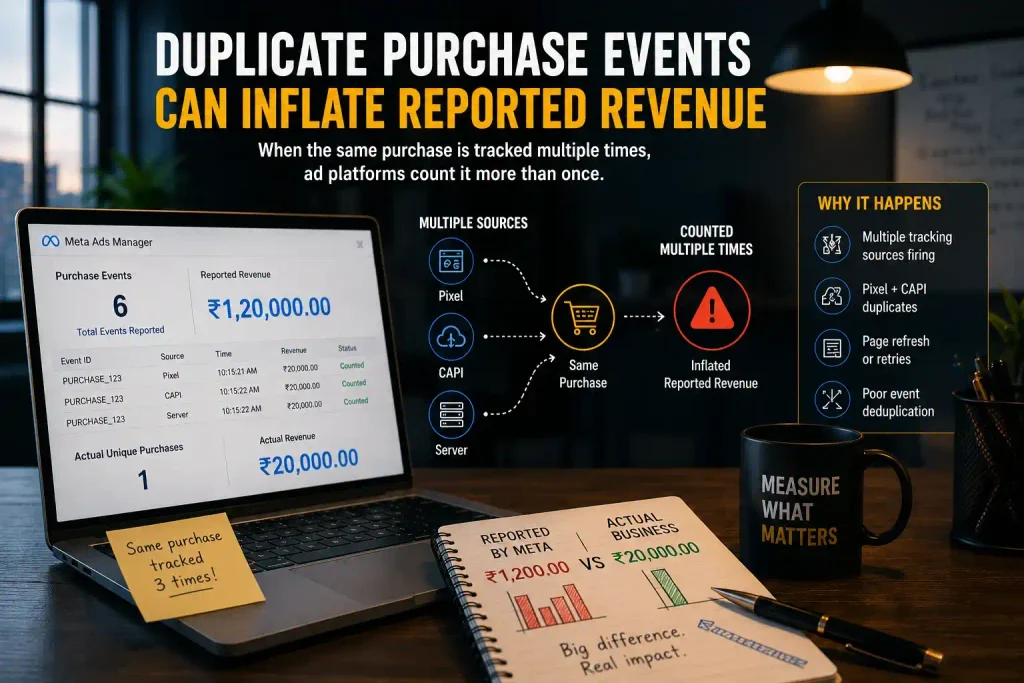
5. Duplicate Purchase Events Can Inflate Reported Revenue
Suppose one customer completes one $300 order.
Your website records:
1 purchase = $300
But a technical implementation accidentally sends the Purchase event twice.
Meta may receive:
2 purchase events = $600
Now the advertising dashboard can show inflated conversion value.
This is why event quality matters as much as campaign optimisation.
Combining Conversions API with the Pixel is suggested by Meta to measure events on the website.
In order to effectively employ both browser and server-side tracking, you need accurate event deduplication and transaction identifier consistency. In case you choose the Social Media Management option, it will assist in aligning data from different campaign channels.
6. Meta May Be Using a Different Revenue Definition
Revenue is not always the same number across platforms.
Consider a $100 order.
Your ecommerce system may record:
$100 gross order value
Your finance team may record:
$92 net revenue
after a discount, tax treatment or adjustment.
After a refund, the realised revenue may become:
$72
This is because Meta may still be measuring the value of the first purchase you made without passing further modifications to the ad measurement process.
This creates a fundamental reporting difference.
Before comparing ROAS, define exactly what “revenue” means.
| Revenue Definition | Example |
| Gross sales | 100,000 |
| Discounts | -$8,000 |
| Refunds | -$5,000 |
| Net sales | $87,000 |
| Cost of goods | -$40,000 |
| Contribution before advertising | $47,000 |
| Advertising spend | -$20,000 |
The ROAS of the campaign may appear impressive whereas economics of contribution might paint a completely different picture.
7. Reporting Dates and Conversion Dates May Differ
Yet another neglected problem area is the distinction between:
When the ad interaction happened
and
When the conversion happened.
Suppose someone clicks an advertisement on August 31 but purchases on September 2.
Depending on the method used for reporting, that particular purchase can be attributed to different periods, which is the reason that when assessing the performance of campaigns, Social Media Marketing Services should take into consideration attribution windows and reporting dates as well.
Google Analytics makes a difference between reporting based on event timing and ad timing in its attribution reports.
This matters when a marketer compares:
Meta Ads: August 1–31
against
Shopify sales: August 1–31
without considering delayed conversions.
The two reports may not be measuring the same cohort.
8. Time Zones Can Create Reporting Differences
Time zones seem unimportant until you’re handling big advertising accounts.
Assume that Meta follows one time zone according to one source, but your analytics platform follows another.
A purchase occurring shortly after midnight can therefore fall into different reporting dates.
Google has mentioned the disparities between the time zone settings of accounts and properties as reasons for reporting differences.
For high-spend accounts, reporting should therefore use a clearly documented time zone across:
- Ad platforms
- Analytics
- Ecommerce platforms
- CRM
- Reporting dashboards
Otherwise, daily numbers can appear inconsistent even when the underlying tracking is working.
9. Customers Rarely Follow a Single-Channel Journey
Modern customers rarely behave like this:
Meta ad → website → purchase
Their journey is more likely to look like:
Instagram → Google → website → email → direct visit → purchase
Or:
Facebook → website → WhatsApp enquiry → sales call → purchase
Or:
Instagram video → branded search → product page → retargeting ad → purchase
As the process becomes more complex, it becomes harder for one channel to capture the complete economic impact of the process; therefore, SEO services become an essential aspect of assessing the contribution of each channel to business growth.
The Interactive Advertising Bureau has pointed to the complexities of attribution in digital marketing, which include not only how to reliably identify users across devices but how to value multiple touchpoints.
This is why channel-level ROAS must be considered in light of the larger business picture.
Meta Ads ROAS vs GA4 vs Shopify vs CRM :
When comparing figures across different platforms, the first step is knowing what each system aims to achieve.
Shopify elaborates on how various attribution models, which are used by platforms like Meta Ads, Google Analytics, and Shopify, give conversions credit differently. It enables marketers to see why the same campaigns may generate varying amounts of revenue, conversions, and ROAS on different reporting platforms.
| Platform | Primary Question | Typical Strength |
| Meta Ads Manager | How much conversion value is attributed to Meta? | Campaign optimisation |
| GA4 | How do users and channels contribute to key events? | Cross-channel analysis |
| Shopify / Ecommerce | What orders and revenue were recorded? | Transaction reporting |
| CRM | Which leads became customers? | Sales attribution |
| Finance system | What revenue and profit were realised? | Financial truth |
| Marketing dashboard | How are channels performing together? | Decision-making |
That is why it is not correct to tell the client from the Social Media Marketing Agency that “one channel is the source of truth.”
Meta is highly useful for Meta campaign optimisation.
Your ecommerce platform is highly useful for order reconciliation.
Your finance system is essential for profitability.
Your CRM is essential for lead-to-sale analysis.
It is not the intention to make all systems display the same figure.
The aim is to find out the reasons behind this difference and determine which of the figures is to prevail.
How to Diagnose a ROAS Discrepancy ?
If Meta has reported ROAS of 5.2x and your company’s report has shown 3.1x, then there is no need to modify
Run a reconciliation.
Step 1: Compare Ad Spend First
Check that both reports use exactly the same:
- Account
- Campaigns
- Date range
- Currency
- Time zone
- Spend definition
A $20,000 spend report and a $19,200 spend report cannot produce the same ROAS.
Step 2: Compare Purchase Counts
Create a simple comparison.
| Metric | Meta | Ecommerce | Difference |
| Purchases | 420 | 365 | 55 |
| Revenue | $63,000 | $54,750 | $8,250 |
| Spend | $15,000 | $15,000 | $0 |
| Reported ROAS | 4.20x | 3.65x | 0.55x |
Now investigate the 55-purchase difference.
Do not jump straight to campaign optimisation.
The structured evaluation of search engine marketing campaigns would be helpful in finding the reasons for the ROAS difference and establish that this is due to attribution, tracking, reporting window, or performance issue.
Step 3: Compare Purchase Values
Look for:
- Missing transaction IDs
- Incorrect currency
- Duplicate events
- Incorrect decimal values
- Test transactions
- Cancelled orders
- Refunds
- Discounts
- Tax differences
- Shipping differences
One incorrectly configured value parameter can create a surprisingly large ROAS distortion.
Step 4: Inspect the Attribution Configuration
Document:
Attribution window + conversion event + attribution model + reporting date
Without these four pieces of information, the ROAS number is incomplete.
Step 5: Reconcile Revenue to Actual Orders
The final check should connect advertising data with actual commercial transactions.
For ecommerce:
Meta → Pixel/CAPI → Website → Ecommerce Order → Finance
For lead generation:
Meta ➔ Lead ➔ CRM ➔ Qualified Lead ➔ Opportunity ➔ Close Deal ➔ Revenue
The latter model is especially crucial for a Digital Marketing Company in Ahmedabad dealing with B2B firms or expensive service offerings.
A $2,000 lead is not equivalent to a $2,000 sale.

The 5-Layer ROAS Audit Framework :
A practical way to investigate discrepancies is to audit ROAS across five layers.
| Layer | Question | What to Check |
| 1. Spend | Did we spend the same amount? | Meta spend, currency, date |
| 2. Tracking | Did we capture the conversion correctly? | Pixel, CAPI, events |
| 3. Attribution | Who received credit? | Windows, models, touchpoints |
| 4. Revenue | Is the value accurate? | Orders, refunds, discounts |
| 5. Profitability | Did the campaign make money? | Margin, CAC, contribution |
Most reporting problems happen because marketers jump directly from Layer 1 to Layer 5.
They see spend and revenue, calculate ROAS and declare a winner.
A Practical Example of a Meta ROAS Discrepancy :
Imagine an ecommerce brand spends $30,000 on Meta advertising.
Meta reports:
$150,000 attributed revenue
Therefore:
$150,000 ÷ $30,000 = 5.0x ROAS
The marketing team celebrates.
But the finance team reports:
$105,000 net sales
The business’s blended advertising revenue is therefore:
$105,000 ÷ $30,000 = 3.5x
After analysing the account, the agency discovers:
- Some purchases were also influenced by Google Search.
- Several customers returned through direct traffic.
- Meta attributed conversions within its reporting rules.
- $8,000 of sales were later refunded.
- $4,000 of discount value was treated differently across systems.
- Some purchase events were delayed.
- The business had additional advertising expenditure on Google and other channels.
This is a good practical example for a Digital Marketing Agency to understand how gaps are created between Meta-reported ROAS and actual business performance due to variations in attribution, tracking, and revenue.
Now the 5.0x Meta ROAS makes more sense.
It was not necessarily fabricated.
It was measuring Meta-attributed value under Meta’s measurement framework.
The 3.5x figure was measuring net ecommerce revenue against Meta spend.
Both numbers answer different questions.
The management question becomes:
“Is Meta generating enough incremental and profitable revenue to justify the next $30,000 of investment?”
That is much more useful than arguing about whether 5.0x or 3.5x is “correct”.
How a Digital Marketing Company in Ahmedabad Should Report ROAS ?
A professional reporting system should separate three different measurements.
The marketing ROI research by Nielsen helps us understand why companies need to link advertising analysis to business results and take a more holistic perspective on marketing effectiveness.
Platform ROAS
ROAS on Platform reflects the income earned from Meta’s efforts in advertising divided by the money spent. The metric is especially helpful when analyzing campaigns, ad sets, and creatives from the Meta Platform, since it relies on its own data about conversions and attribution.
But platform ROAS does not necessarily indicate the return on investment for the business. With the help of Digital Marketing Services, the organization can get to know if the campaign with 5x ROAS from Meta will yield the same returns or not when other factors such as marketing activities, refunds, costs, and conversion without ads are taken into account.
Blended ROAS
ROAS blending is the analysis of total marketing revenue versus total advertising spend. As opposed to evaluating how much revenue the firm is making from its claims, it focuses on the overall link between advertising spends and company’s revenues.
For instance, if an organization makes $200,000 worth of sales after spending $50,000 on advertisements through Meta, Google, and other paid platforms, the aggregate ROAS will be 4x. This gives management a more holistic idea about how their organization performs in terms of advertising and prevents putting too much emphasis on any single platform.
Profit-Based ROAS
ROAS based on profits takes it to another level whereby the consideration is taken on the contributions made after taking into account the variable costs. It is possible for a business to have good sales but poor profitability due to the variable costs incurred.
For instance, a Digital Marketing Company could calculate an ad campaign worth $100,000 in sales that cost $20,000 in advertising expenses. In this case, we have a 5 to 1 ratio for return on investment for sales. However, if only $30,000 is left after covering variable costs, the situation becomes economically quite different for the business.
An advanced agency must therefore provide its client with platform ROAS, combined ROAS, and profitability-based performance measures. Such an approach will enable the client to clearly understand the results reported by its platforms, the performance of the entire marketing campaign, and the actual profit for the business.
How to Make Meta ROAS Reporting More Reliable ?
Strengthen Your Tracking Infrastructure
A valid Meta ROAS report begins with proper conversion tracking. It is necessary to set up the Meta Pixel correctly and use Conversions API when appropriate to track purchases with greater accuracy. Each purchase event should include the right purchase amount, currency, and transaction ID.
Consistently perform audits on the tracking setup to detect gaps, duplicates or wrong configuration of events. In cases where there is a combination of browser and server-side tracking, event deduplication becomes extremely important. There’s also Social Media Management that can ensure a consistent monitoring of campaigns. These technical adjustments will avoid either an overestimation or underestimation of ROAS by your marketing department.
Use Consistent UTM Parameters
Having similar UTM parameters allows GA4 and other tracking tools to accurately recognize traffic from Meta campaigns. It is important to use a uniform naming convention while creating parameters such as source, medium, campaign, and content in all the campaigns.
For instance, by applying utm_source=meta, utm_medium=paid_social and keeping your campaign names consistent, your analytics data will stay organized as you grow your campaigns. By consistently following UTM conventions, it is easier for marketers to compare the numbers provided by Meta with their sessions, conversions and revenue.
Reconcile Meta Against Actual Transactions
The reported earnings by Meta need to be compared against the transaction made in your online store or the CRM system you use. In case of more reported earnings by Meta, there could be reasons for it, such as duplicate events, different attribution, cancellations, refunds, or even incorrect values of purchases. This can be accomplished through social media marketing services.
In the context of lead-generation campaigns, reconciliation must extend past the lead itself. It’s important to trace the lead through to the qualified prospect, the sales opportunity, and the closed customer. This allows for a better understanding of whether Meta is bringing in real business or just lots of attributed conversions.
Build a Reporting Lag
However, ROAS is not always to be measured right after the campaign duration because it may take a while before the customers convert after coming into contact with the ad. The conversion and attribution metrics may also vary depending on the data that is being added by the platform.
It is practical to adopt a daily report for tracking, a weekly report for campaign optimisation, and a monthly report for revenue reconciliation. By doing this, you avoid making unnecessary adjustments due to the temporary fluctuations, and you provide your team with a more steady picture of the real advertising performance.

When Should You Trust Meta’s ROAS ?
Trust Meta ROAS for what it is designed to do:
campaign optimisation and platform-level performance analysis.
Do not automatically use it as the only measure of:
- Business profitability
- Incremental revenue
- Total marketing ROI
- Customer lifetime value
- Contribution margin
- Overall company growth
A useful rule is:
Optimize Meta using Meta. Measure the business using your wider set of metrics. Social Media Marketing Agency will assist you in linking the platform performance with the larger metrics that impact your business results.
That distinction prevents many poor advertising decisions.
For instance, a campaign with 6x Meta ROAS would be scaled aggressively since the metric is impressive.
However, if the marketing campaign mainly consists of acquiring customers who would have bought anyway, the incremental ROAS can be significantly lower.
Alternatively, the prospecting campaign can exhibit a lower ROAS for the platform while bringing in new customers who buy again and again.
The first campaign may look better in Ads Manager.
The second may be more valuable to the business.
This is where customer lifetime value and incrementality become important.
The Difference Between Attributed ROAS and Incremental ROAS :
This is one of the most important concepts in modern performance marketing.
Attributed ROAS asks:
How much revenue did the platform receive credit for?
Incremental ROAS asks:
How much additional revenue happened because of the advertising?
Those are not the same measurement.
The only way to measure the impact in an accurate manner is by introducing strong experiment or quasi-experiment testing, where required, including using methods such as holdout test, geography test, etc. A Digital Marketing Company will assist you in designing such tests and analysing the same to understand the actual increment generated by advertising.
The guidelines on attribution from IAB further stress that attribution essentially involves attributing value to consumer actions and measurement methods can be influenced by data availability and identification challenges.
For sophisticated advertisers, the progression is:
Platform ROAS → Blended ROAS → Contribution ROAS → Incremental ROAS
Each layer answers a deeper business question.
What This Means for Social Media Marketing Services ?
There is more to an effective strategy than just impressions, clicks, buys and ROAS.
The reporting format must relate advertising to business success.
For ecommerce:
Creative → Click → Product View → Add to Cart → Purchase → Repeat Purchase
For lead generation:
Creative → Click → Lead → Qualified Lead → Sales Opportunity → Customer → Revenue
For B2B:
Ad → Lead → MQL → SQL → Opportunity → Closed Won → Contract Value
This is the reason that Social Media Management and paid social reporting cannot be viewed as completely distinct business functions.
Organic social will generate demand, paid social will capitalize on the demand, while search will capture the demand, and email will convert the demand.
The customer sees one brand.
Your reporting system should eventually connect the journey rather than forcing every interaction into an isolated channel box.
Conclusion: Your Meta ROAS Is a Measurement, Not a Verdict
So, why is your ROAS different from what Meta reports?
The reason is that there may be differences between the attribution model used by Meta and your company’s system in terms of conversion windows, revenue, and reporting date.
Meta’s number can be useful.
Your ecommerce or CRM number can also be useful.
The mistake is expecting them to answer exactly the same question.
A more advanced performance marketing approach views ROAS as a measurement structure and not as one absolute truth.
Businesses should seek to create a reporting mechanism where platform data, analytics, e-commerce transactions, and business results get reconciled rather than going for the dashboard that has the largest figure. This would assist businesses to make better choices while collaborating with a Digital Marketing Company in Ahmedabad.
The best reporting question is not:
“Which platform says we have the highest ROAS?”
It is:
“How much profitable and incremental revenue is our marketing actually creating?”
As long as you can do this consistently, Meta ROAS becomes very useful – indeed, more reliable advertising decisions become possible.